Introducing the Track reports
Published in Getting Started
The goal of this feature is to help you build PDF reports with your tracks results, that you will be able to share within your team or with your clients. To make it even better, the report can be branded with your own company logo!
Let’s take a minute to go through the features of this Reporting module.
Two types of report
A report is related to one track of your choice and will gather all the data about this track into one single place. The report can be generated every day, once a week or once a month.
When configuring your report, you have to select the report type you are interested in. You have the choice between:
- Incremental: an incremental report will only contain the data from the report period. It means that for a report generated weekly, the report would only contain the playlists added in the last week, as well as charts positions during the week.
- Full: a full report will contain all the data since the release of the track. All the charts positions and playlists adds would then appear on your report (according to what you will configure).
A lot of settings and filters
We have tried to make the report as customizable as possible, so that you can select exactly the data you need from Spotify and Apple Music. Reports data is mostly split into two categories: charts and playlists.
Charts
We have split the charts data into three different items that you can enable/disable independently.
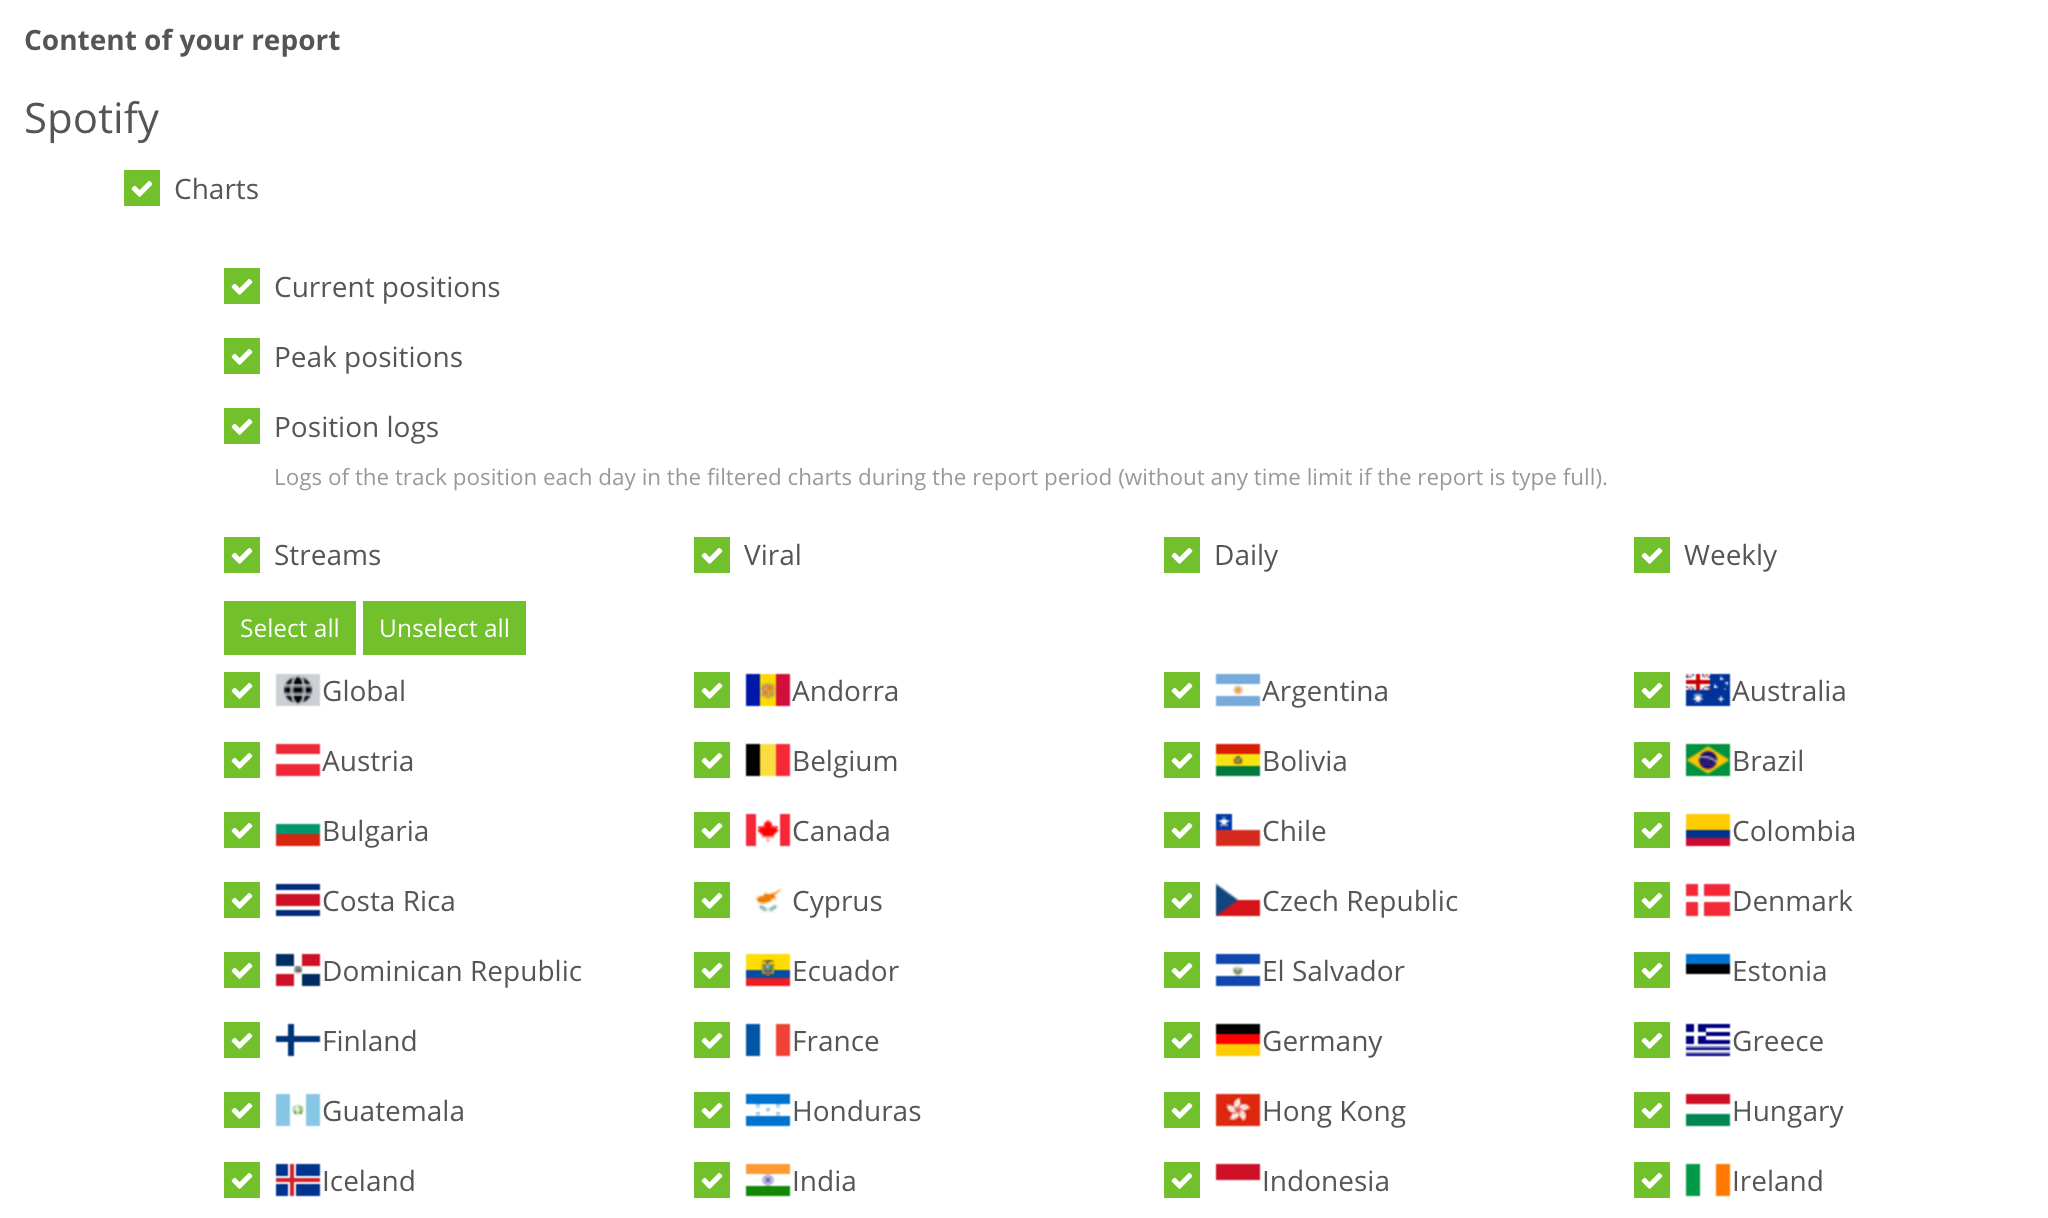
- Current positions: this will show the positions of the track in the charts at the date of the report generation.
- Peak positions: this will show the peak positions of the track in each chart, as well as the date at which it happened. This is not limited to the report period, we will always show the peak positions since the release of the track even if you have selected an incremental report.
- Position logs: you might be interested into the position of the track in each chart each day. Lucky you, we have made this possible with Position logs item that will show you every chart position of the track for the report period (since the release if this is a full report). In case you are creating an incremental daily report, we advise you to not activate the Position logs as it would show exactly the same data as the Current positions item.
Finally if you are only interested in a few markets or charts type (daily/weekly, streams/viral), you can also add your own filters.
Playlists
We know playlists adds is what is most important for most of our users. This is why we have put a lot of attention into this part of the report.
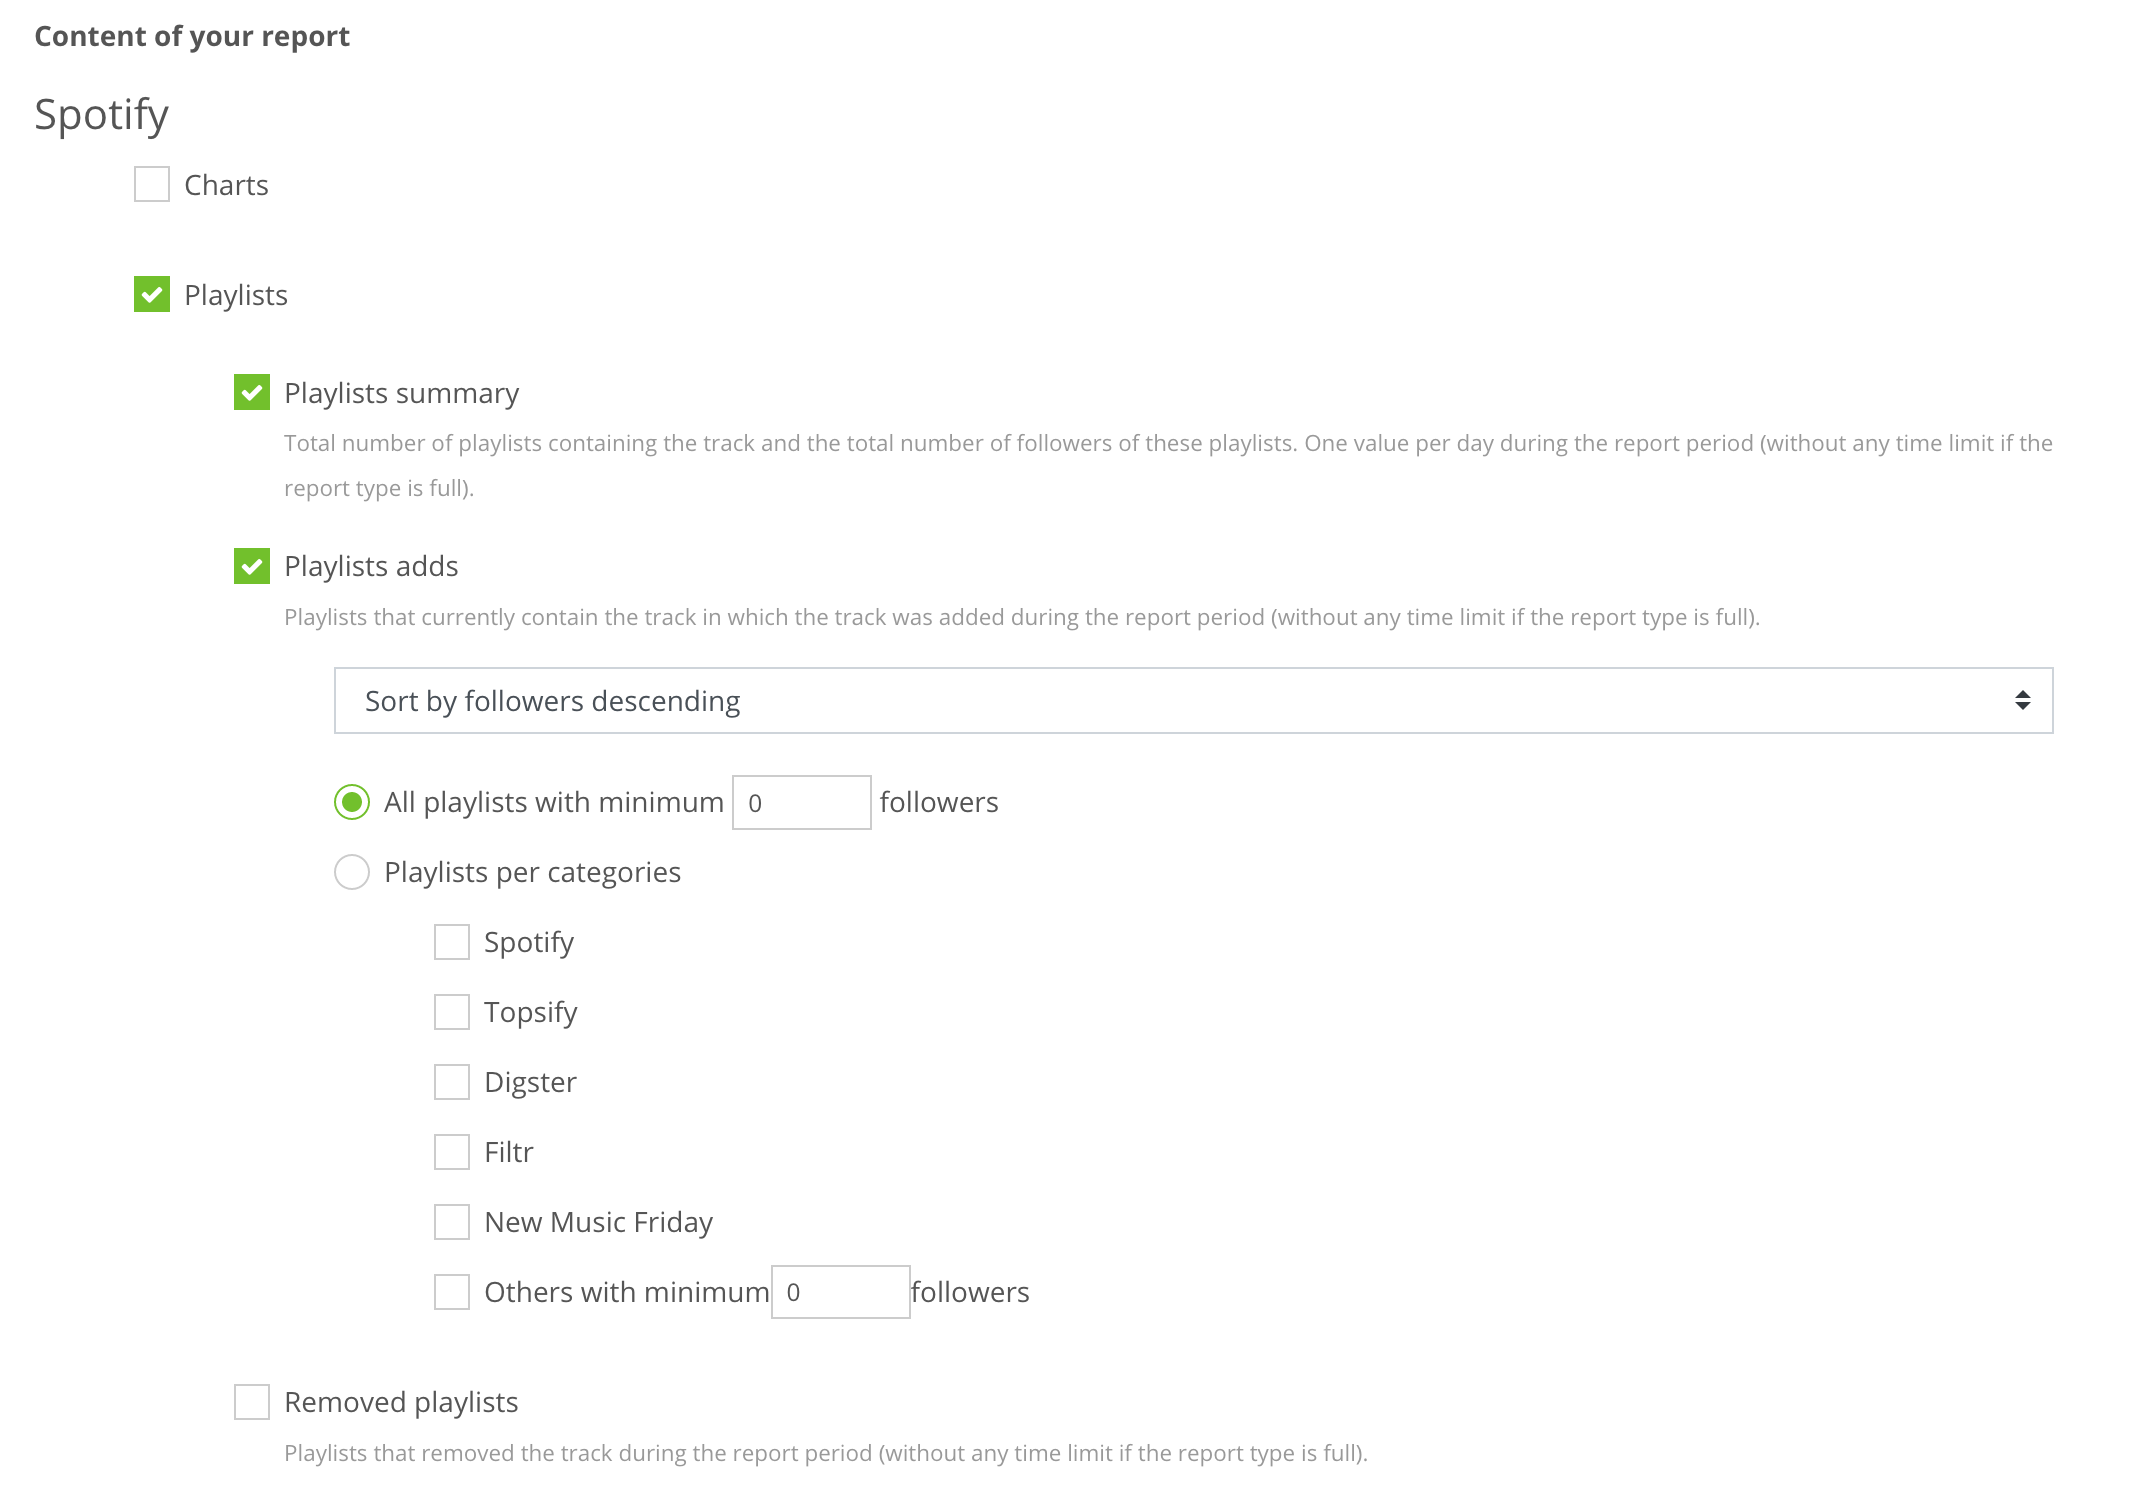
- Playlists summary: this will show you the total number of playlists in which we found your track, as well as the total count of followers for those playlists. We will provide one value for each day of the report period. Please pay attention that if you are building a full report, this section will grow bigger every day as we will show one value per day since the release of the track.
- Playlists adds: this will show you the playlists that added your track during your report period (and that still contain your track when we generate the report). In case you are building a full report, all the playlists currently containing your track will be shown.
- Removed playlists: this section will contain all the playlists that removed your track within the report period (and that do not contain your track when we generate the report).
For the playlists adds and removed playlists, we of course allow you to filter based on the number of followers (Spotify only) as you might want to exclude very small playlists from your report. We also give you the possibility to see the playlists per category instead of one big list. The categories we have now are: Spotify (official Spotify owned playlits), Topsify, Filtr, Digster, New Music Friday, Apple Music (official Apple Music owned playlists). We have tagged manually the playlists into these categories, so in case you find any problem or missing playlist please let us know.
Custom branding
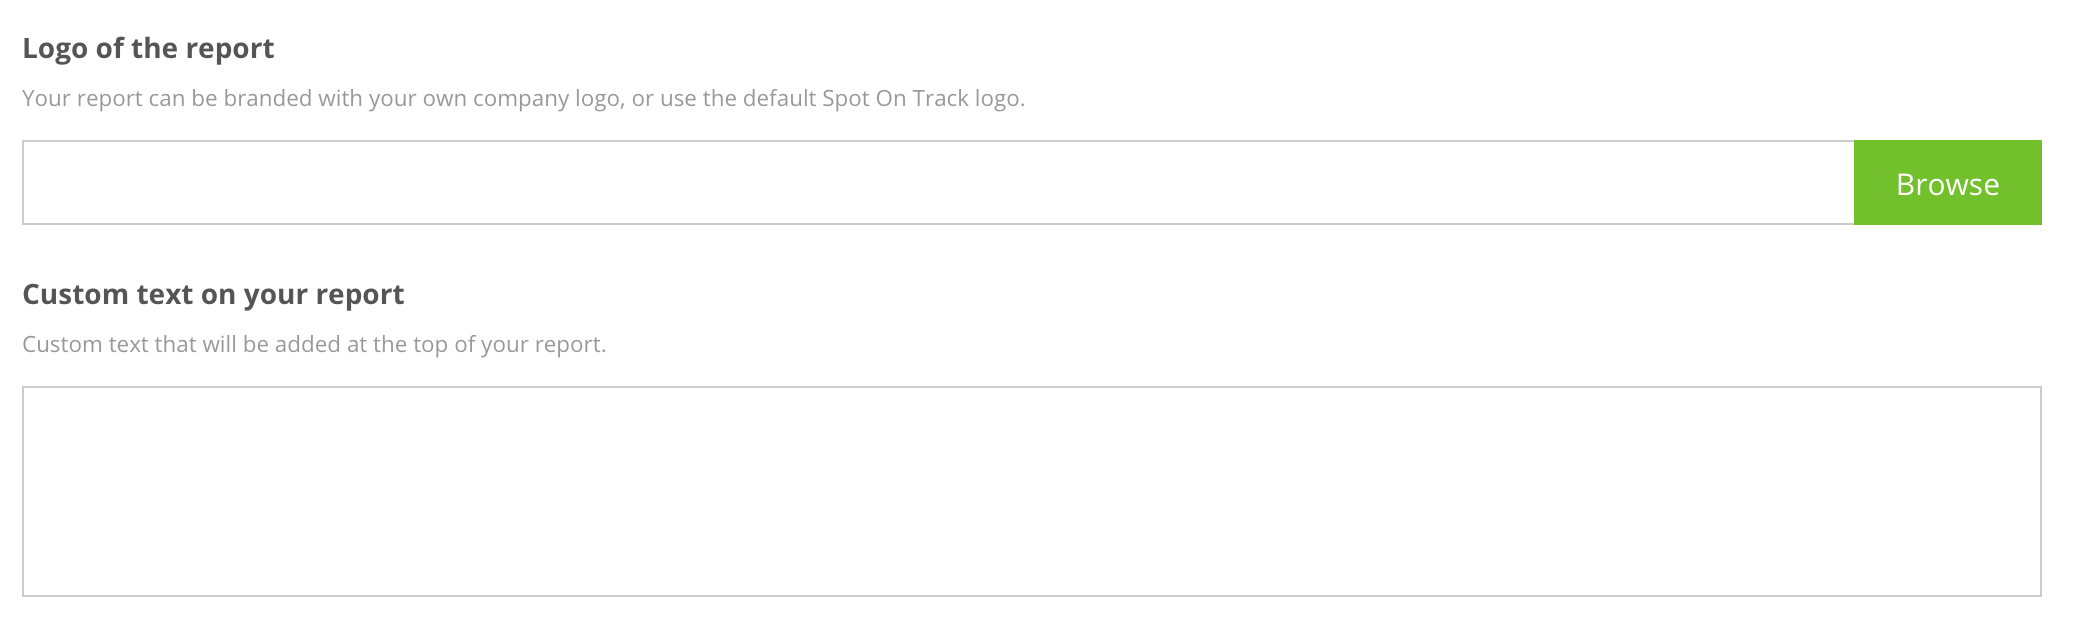
We wanted to make sure that the PDF report that we will create for you will be as useful as possible, which means that you can share it as it is within your company or with your clients.
That is why we allow you to add your own logo at the top of the report and also any custom text you might want to put at the top of your report.
The reports are generated when the daily charts have been published, and are delivered to your inbox as soon as they are computed. Usually, the reports generation happens between 7PM and 9PM (UTC time).
Next to the Track reports, we also offer an other type of report specifically related to Spotify New Music Friday playlists. This is our next step in this Getting Started guide.