Introducing the Track page
Published in Getting Started
Track page is where most of the data is located on Spot On Track. This is where we list all the data we know about the track: metadata, charts, playlists, streams, ...
One track is identified by one ISRC code. All the songs from all the streaming platforms we track are grouped together when they have the same ISRC code. This is what allows us to display aggregated data, just like you need them. However, in some rare occasions, a song is released multiple times on a streaming platform, with multiple ISRC codes even though this is exactly the same song. In that case, we will consider them as two different tracks and the data will not be merged. Now that this little technical aspect is clear, let's see what we have available for you.
The data from the track is split in 8 different tabs, through which you can navigate as you wish.
Overview
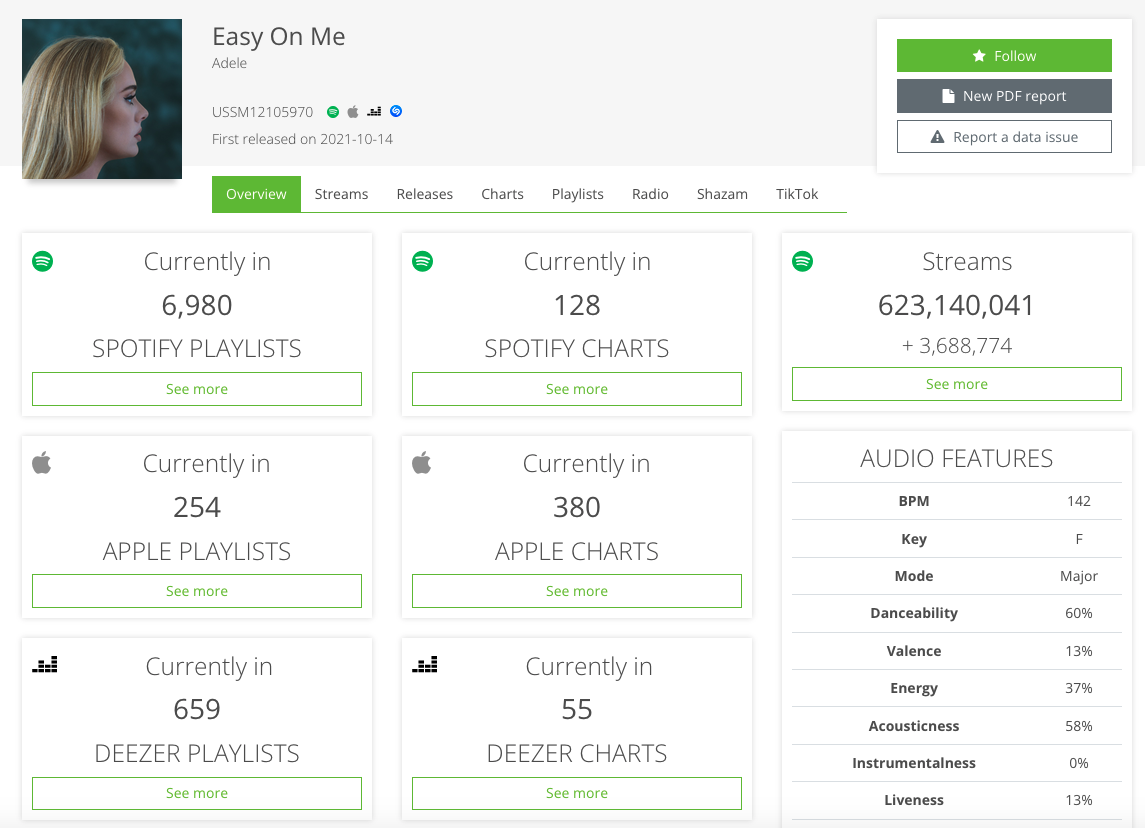
The goal of the overview tab is to show you a very quick summary of the current situation: how many charts and playlists currently contain the track, for each platform, as well as the number of Spotify streams.This is also where we display Audio Features. This data directly comes from the Spotify API.
Streams
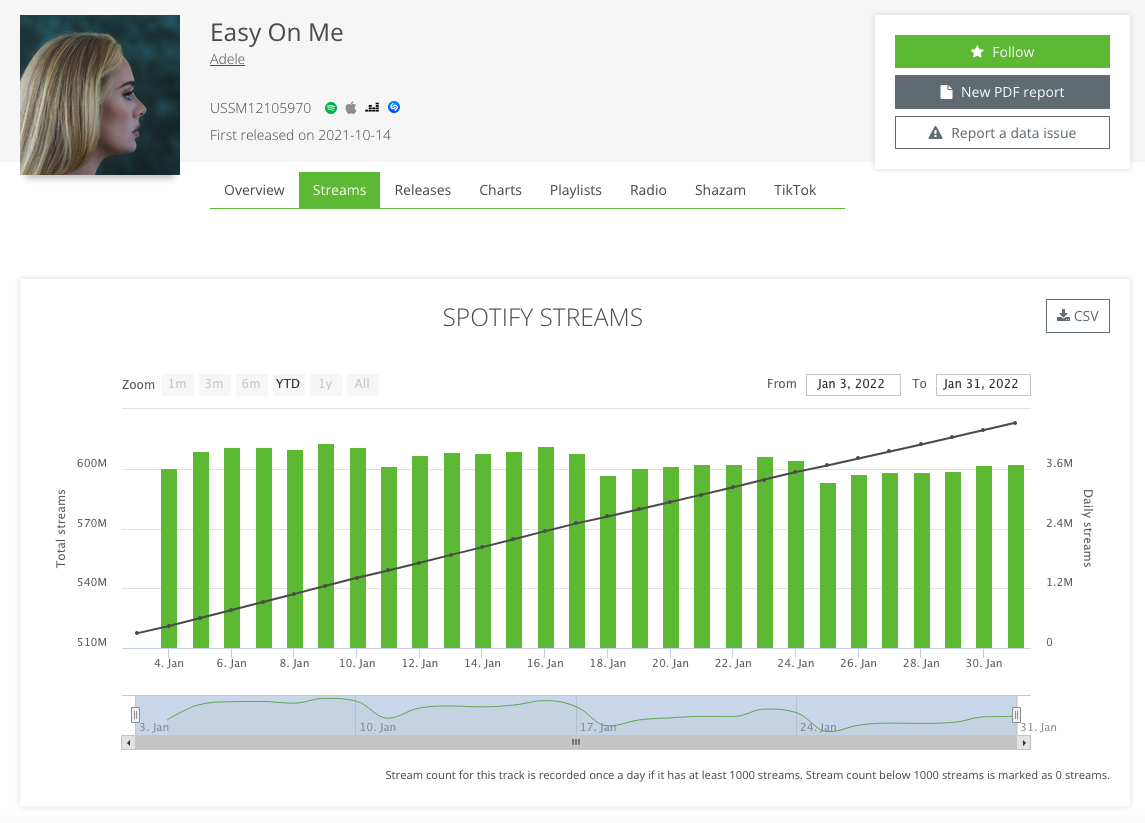
The total stream count of a track on Spotify is public data that is usually the key metric to measure a track success over time. Since early 2022, we record the total stream count every day for millions of tracks. Based on this data, we also compute daily stream count if we have datapoints for two consecutive days.
This data is displayed on a graph, so that you can easily see the trend in just a second. If you need raw data to build your own reporting or analyses, the data is available as csv exports as well.
Releases
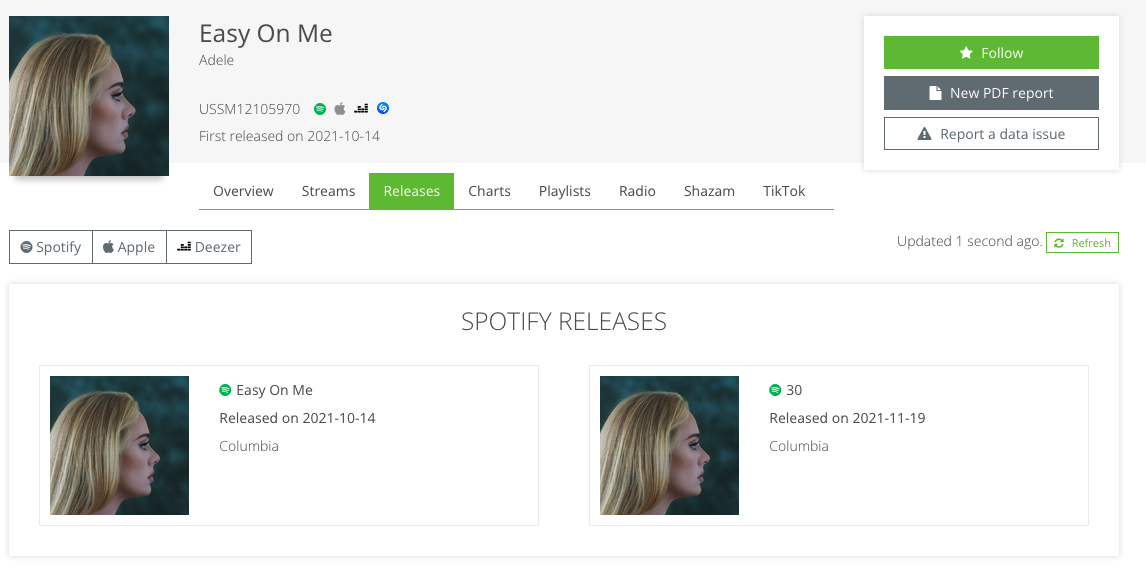
A song is usually released multiple times on each platform (once as a single, maybe once as an albu sometimes within a compilation, or released by different labels on different territories, ...).
On this tab, we list all the releases we know of that contain this track, each with its release date and label.
Charts
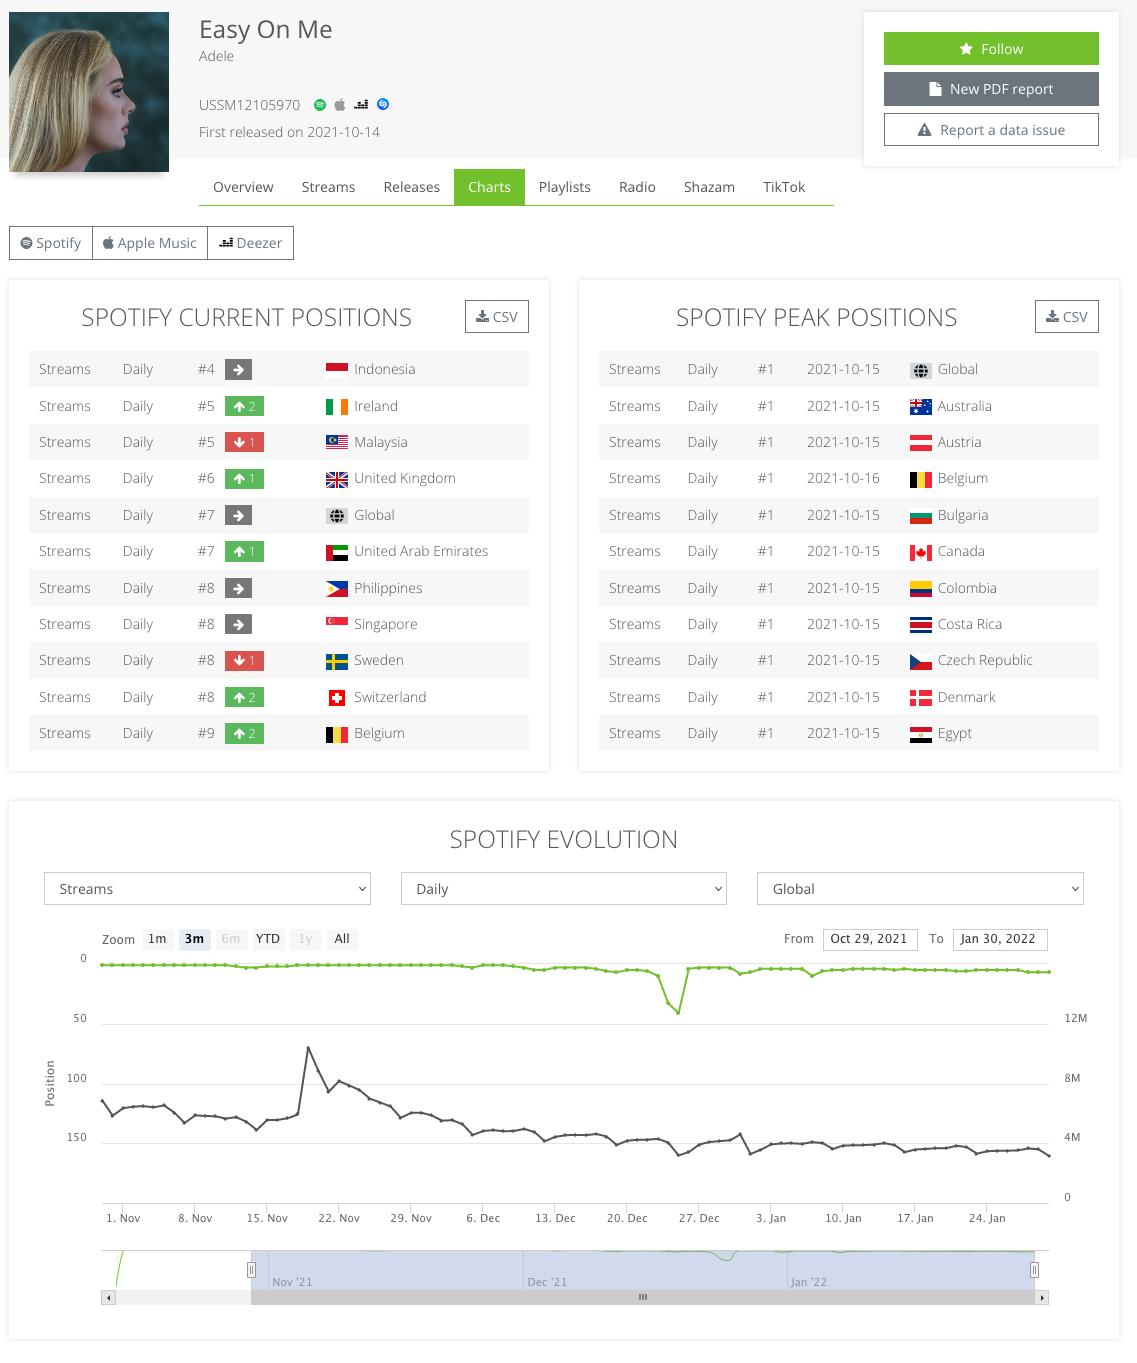
As you can guess, this tab is dedicated to all the charts positions from the track. For each streaming platform, we display three blocks of data:
- Current positions: The data describing the chart depends for each platform. Make sure to scroll on the table to see the full list.
- Peak positions: A very interesting data to know how well the track has been performing in the past. For each peak position, we also display the date at which it first reached this position.
- Evolution: For a selected chart (parameters are different for each platform), the graph shows the evolution day after day. If you are looking at a Spotify 'streams' chart, the daily number of streams will also be displayed (if the chart is related to a country, the number of streams is related to this country only).
Current and peak positions can be exported in CSV files. The export button is located at the top of each section and is available for all our users with a Business subscription or on the free trial. More info about CSV exports.
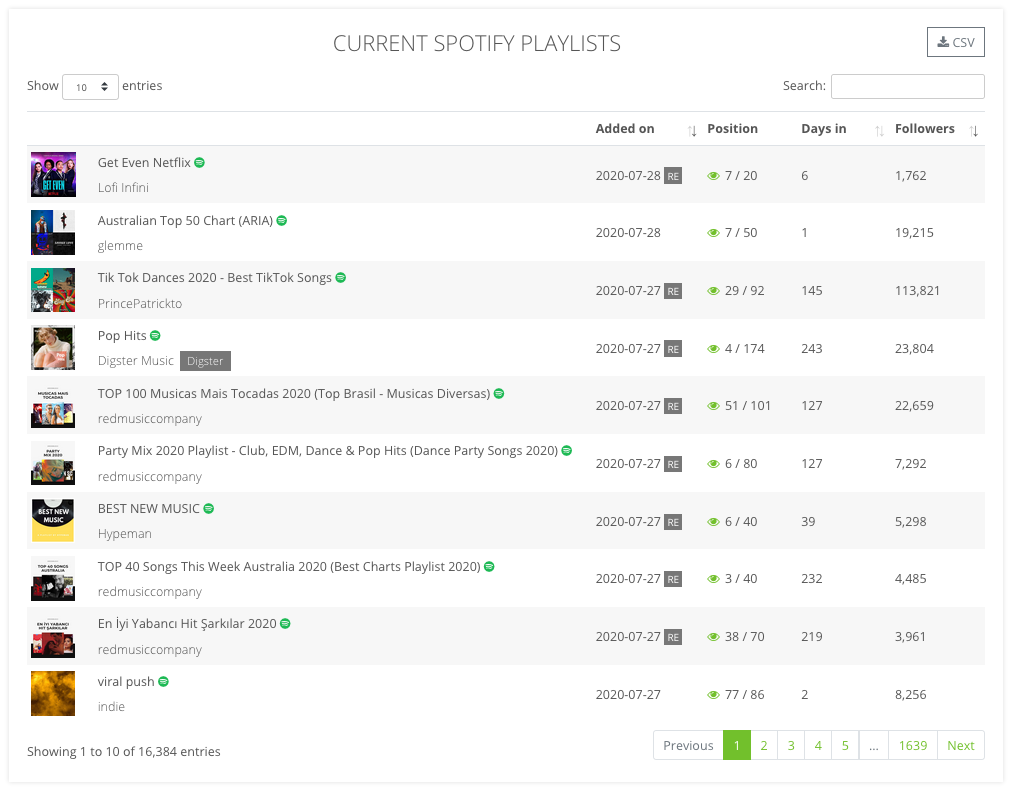
Playlists
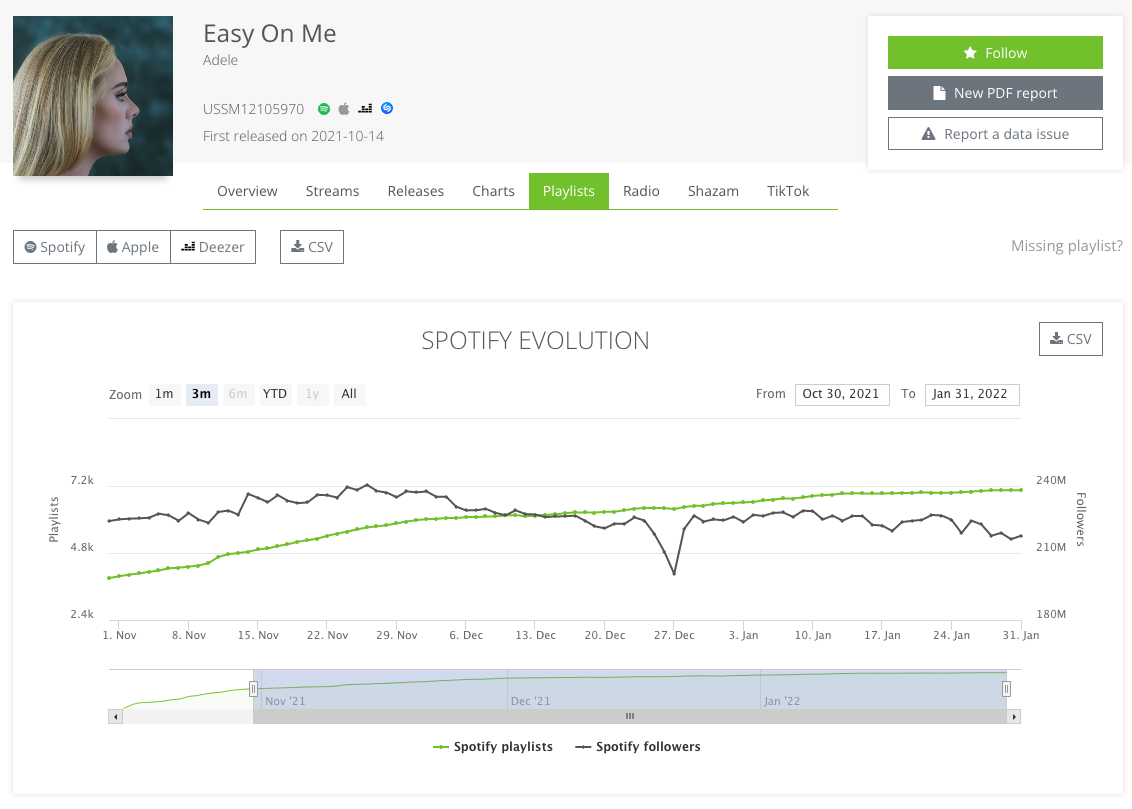
This is the most important data for our users. For each streaming platform, we display three blocks of data:
- Evolution: The graph shows in how many playlists we saw the track each day since the release. The values from this graph are computed once each night. Therefore it is possible that if a playlist added the track but we did not notice the addition yet, this will only be counted as a next day addition. The goal of this graph is more to see a global trend of the evolution than to focus on specific values. For Spotify, the graph also shows the total followers from the playlist. This graph is currently not available yet for Apple Music / Deezer, but will be added soon.
- Current playlists: This is where we list all the playlists that currently contain the track. For each one, we display the added date, how many days it spent in the playlist etc. Each platform has its own specificities: Spotify playlists have a number of followers, Apple Music playlists can be different for each country, ... It is of course possible to search the list and sort it as you wish.
- Removed playlists: If a playlist added your track in the past but removed it since then, the playlist will be listed in this section. Once again, the available data is specific for each platform, in a similar way as the 'Current playlists'.
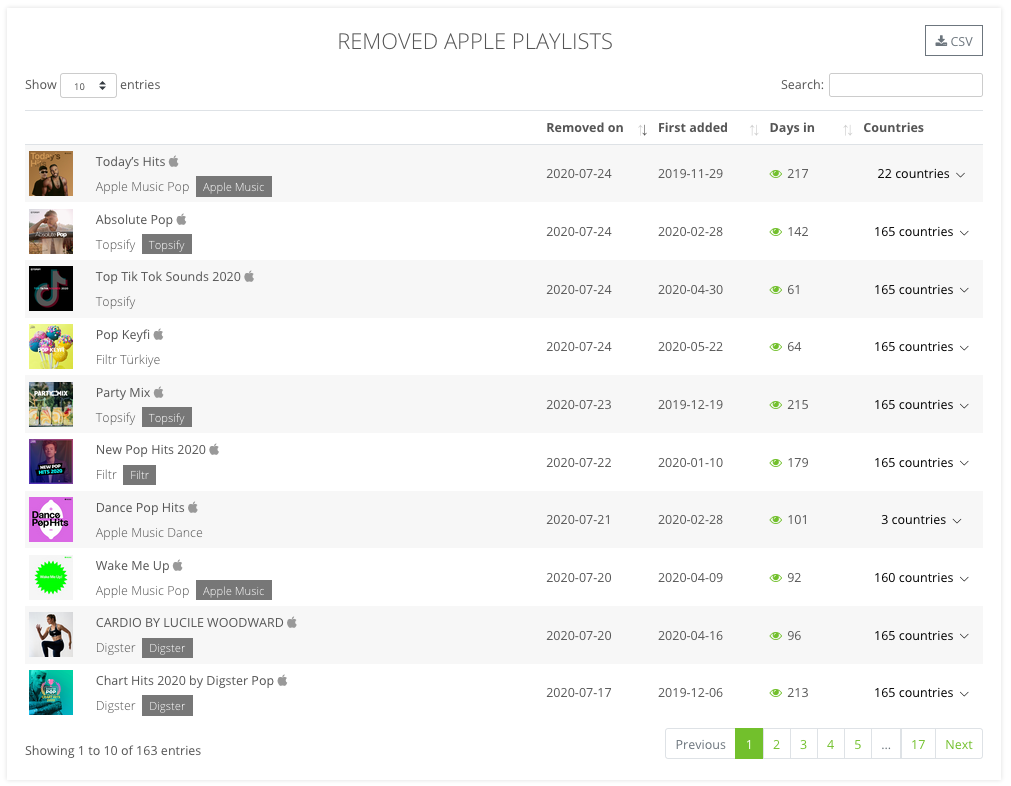
Just like for charts, playlists data can be exported in CSV files.
Radio
Radio data is also available on Spot On Track. Based on fingerprinting technologies and monitoring more than 6000 stations in 100+ countries, our radio data tracking system delivers quality data, that is available in tables, graphs, csv exports or pdfs. Radio data is not included in the subscription but can be bought per track as an add-on.
More info on all the radio features.
Shazam
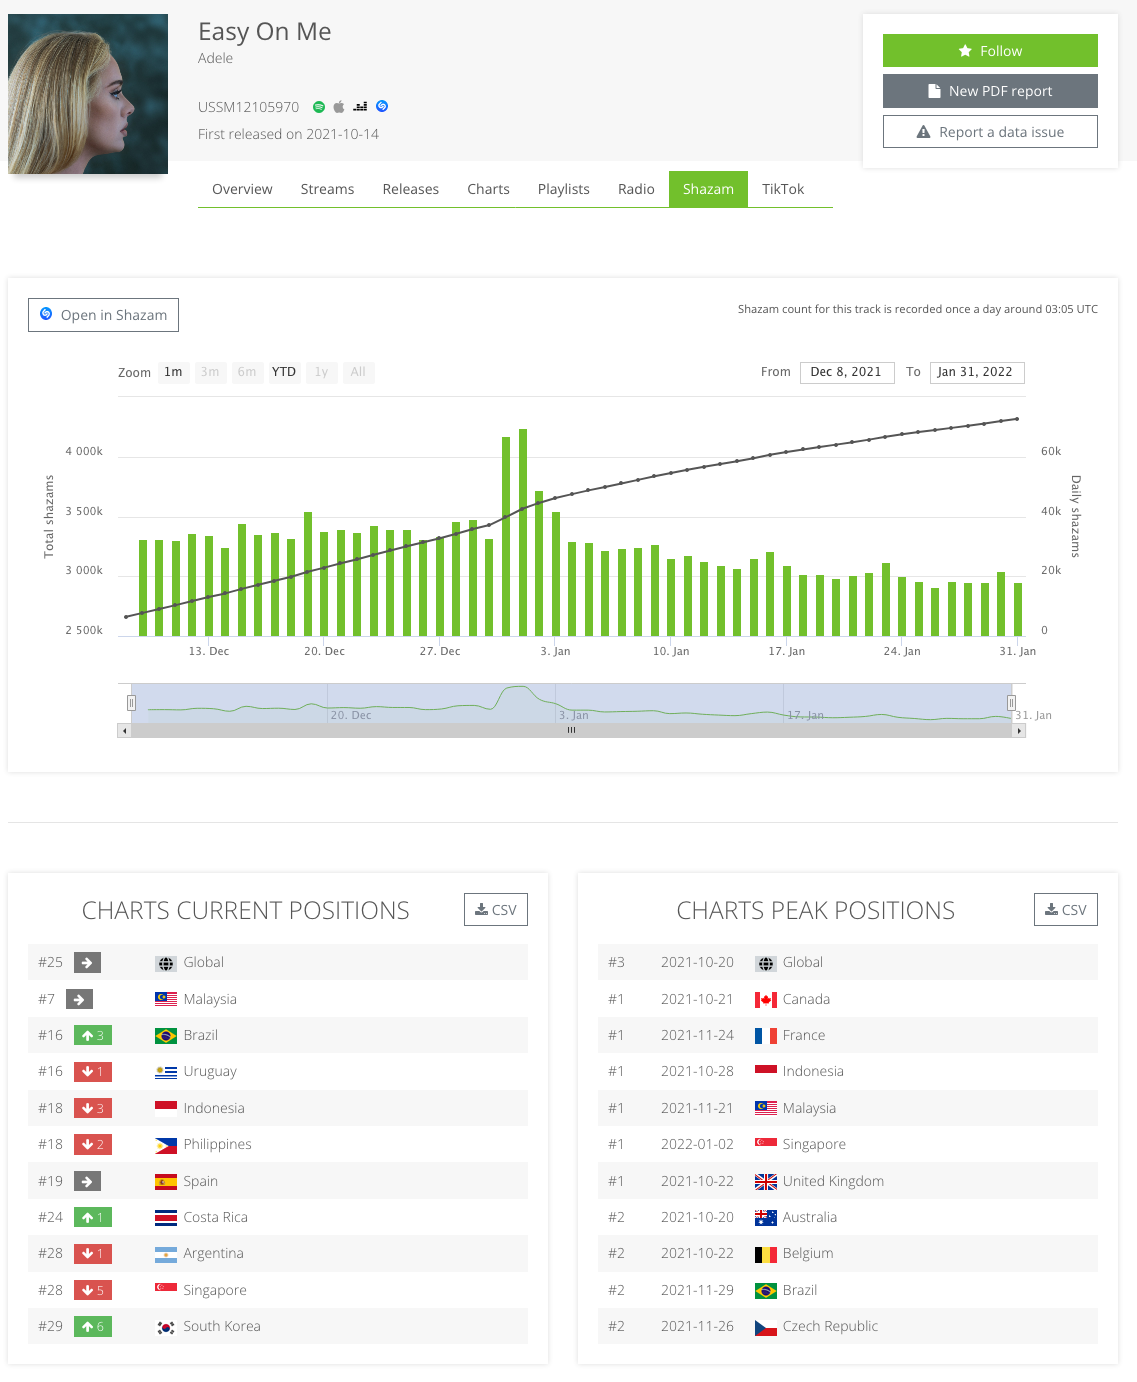
Our Shazam data is mostly split into two different items:
- The total shazams count, which we record every day for all tracks. This is displayed on the graph, and soon available as csv export. Daily values are also computed if we have two consecutive datapoints.
- The Shazam charts the track is currently in, as well the peak position of the track in all the charts.
Tiktok
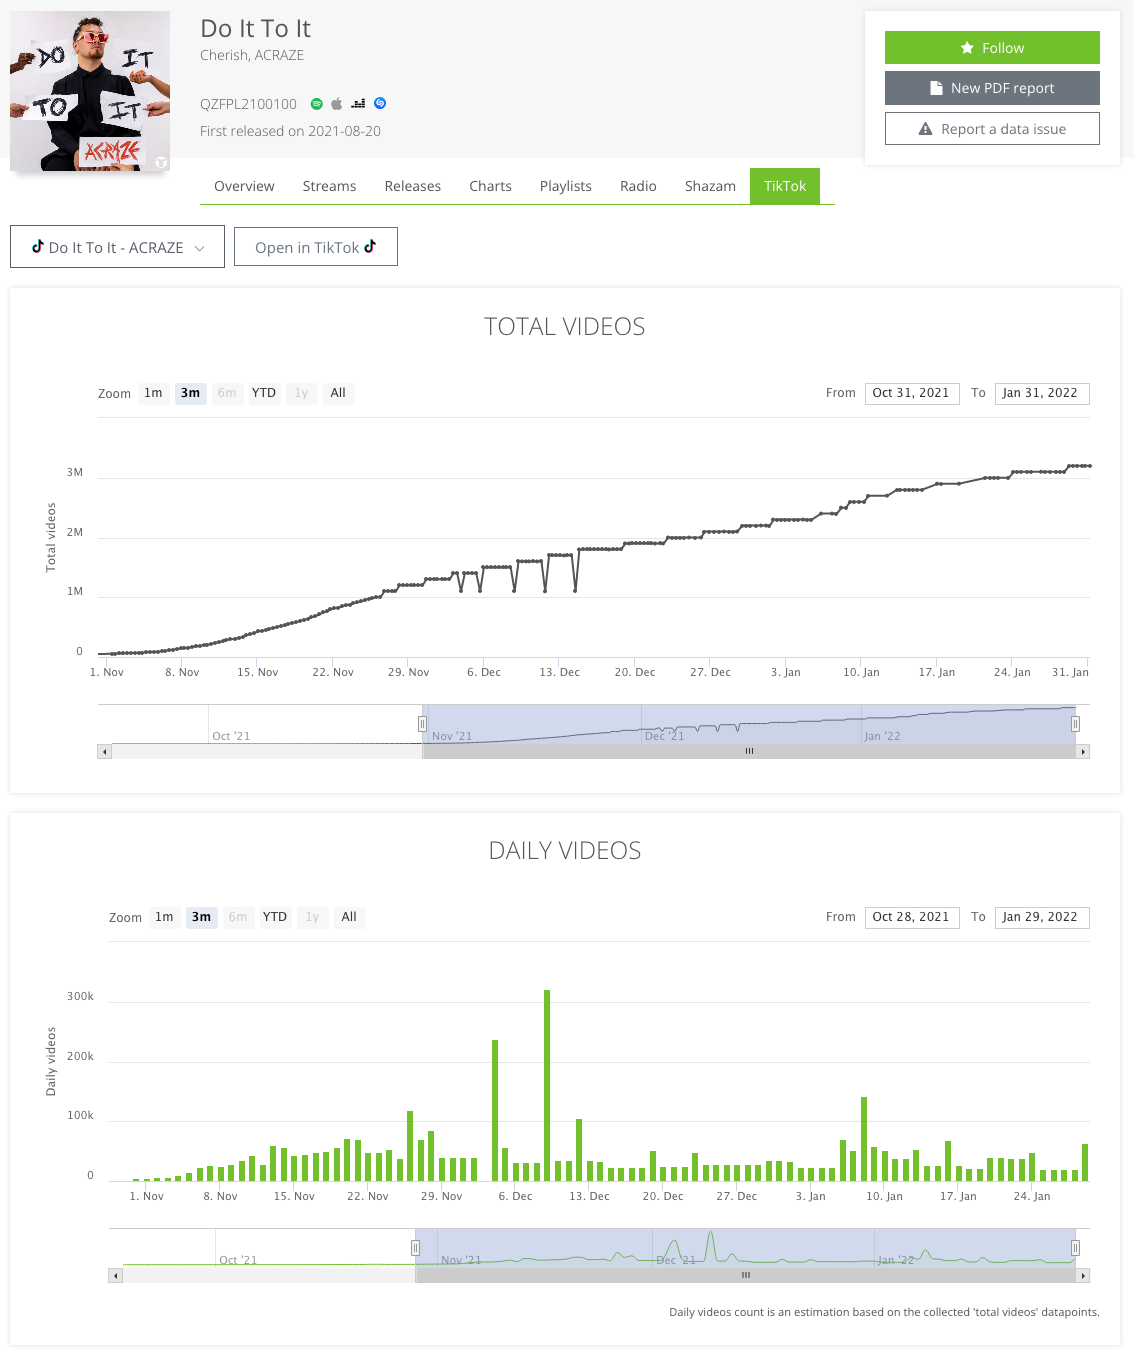
If a TikTok song as been linked to the track, we will monitor the number of videos created. We record the total number of videos regularly and compute or estimate the daily values based on that.
That is of course just an introduction. Feel free to continue our Getting Started guide.